The UI is optional — every action is also available via the REST API and MCP server. The UI uses the same API endpoints under the hood.
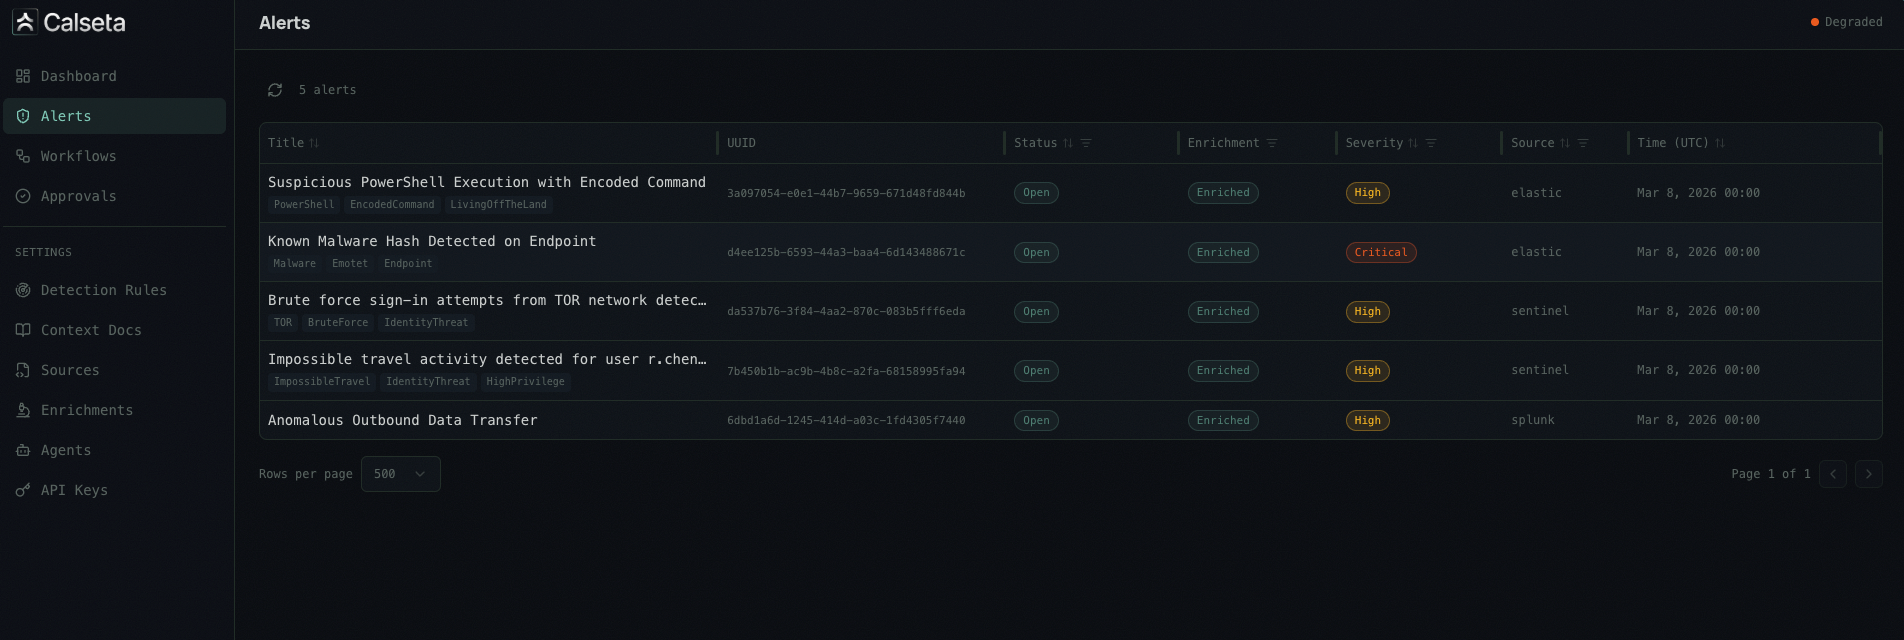
Alerts
Alert Detail
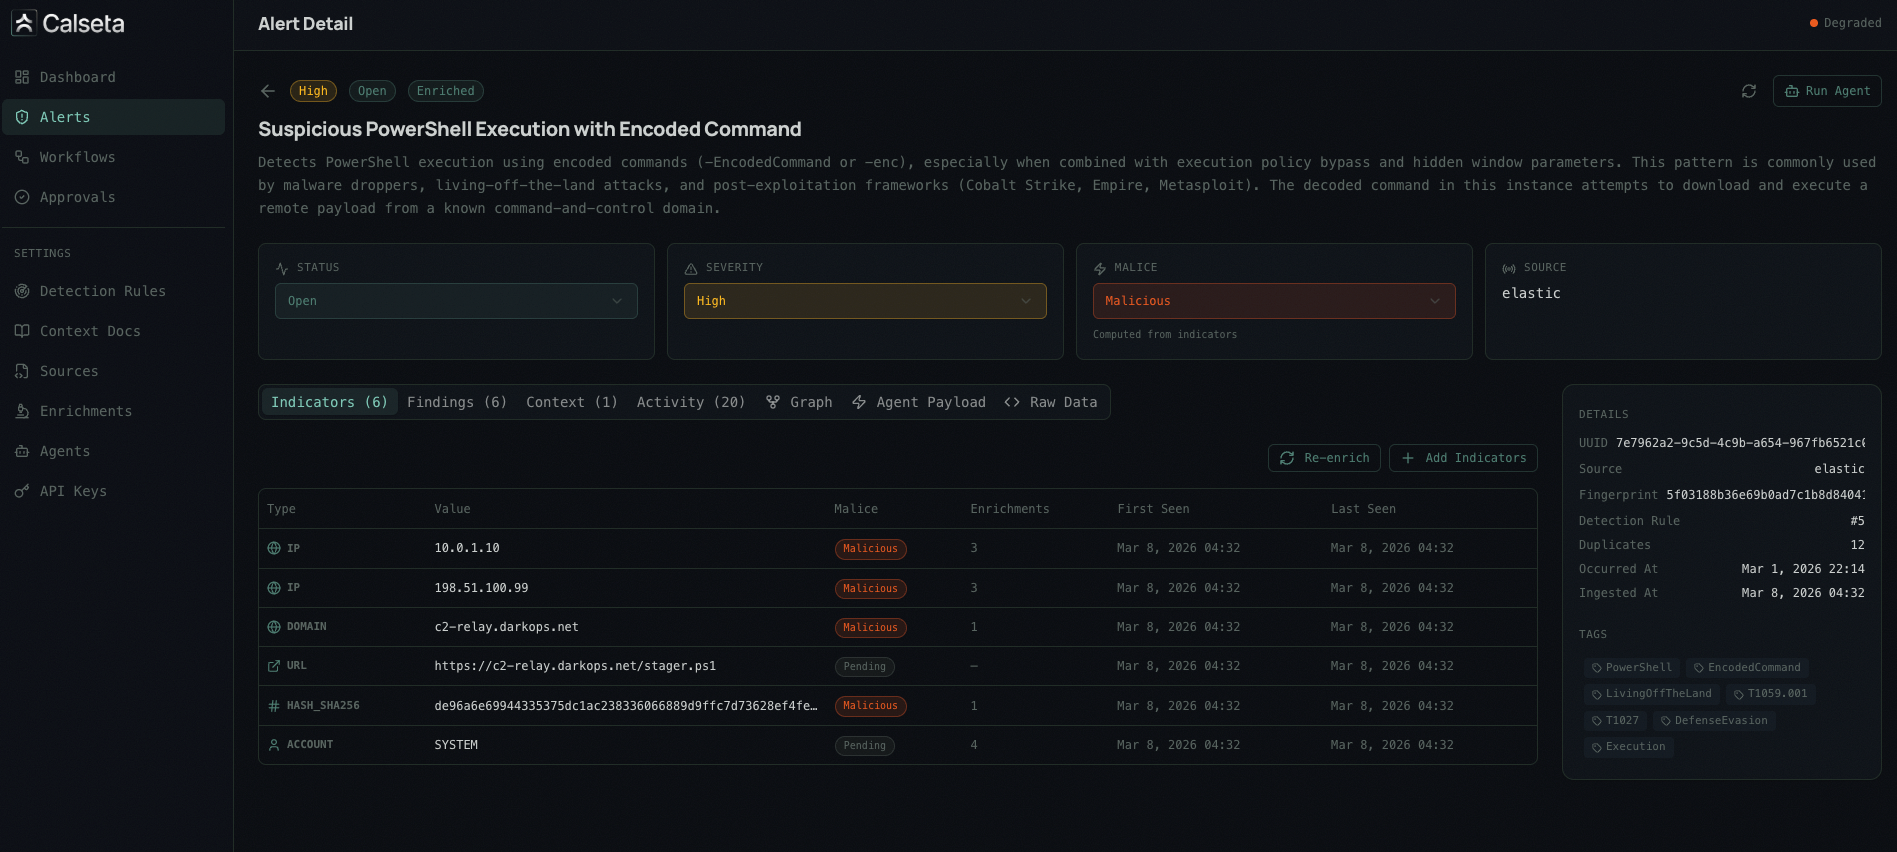
- Alert metadata — title, severity, status, source, timestamps
- Indicators — extracted IOCs with malice verdicts and enrichment results
- Enrichment results — per-provider breakdown (VirusTotal, AbuseIPDB, etc.)
- Context documents — matched runbooks and SOPs
- Activity timeline — audit log of all actions taken on the alert
- Relationship graph — visual map of indicator relationships across alerts
Navigation
The sidebar is organized into three sections:Main
- Dashboard — overview metrics and recent activity
- Alerts — alert list and detail views
- Workflows — workflow code, execution history, and approval settings
- Approvals — pending and resolved approval requests
Manage
- Agents — register and manage agent webhook endpoints with trigger filters
- Enrichments — configure builtin and custom enrichment providers, view status, test against sample indicators. The Field Extractions tab on each provider’s detail page manages which fields from raw API responses are surfaced to agents.
- Detection Rules — view and edit detection rules with MITRE ATT&CK mappings and documentation (auto-created when alerts arrive)
- Context Docs — upload and manage runbooks, IR plans, and SOPs with targeting rules
Settings
- API Keys — create and manage API keys with scoped permissions
- Alert Sources — configure alert source integrations and webhook endpoints
- Indicator Mappings — manage indicator field extraction mappings (system-seeded normalized mappings and custom per-source mappings against raw payloads)
Access
The UI runs as a separate dev server during local development:make dev or make lab, the UI server starts automatically.