> ## Documentation Index
> Fetch the complete documentation index at: https://docs.calseta.com/llms.txt
> Use this file to discover all available pages before exploring further.
# Web UI
> A web dashboard for managing alerts, configuring integrations, and monitoring your Calseta instance.
Calseta includes a web UI at [http://localhost:5173](http://localhost:5173) for visual alert management and platform configuration. The UI is built with React and Vite.
The UI is optional — every action is also available via the [REST API](/api-reference/overview) and [MCP server](/mcp-reference/overview). The UI uses the same API endpoints under the hood.
## Alerts
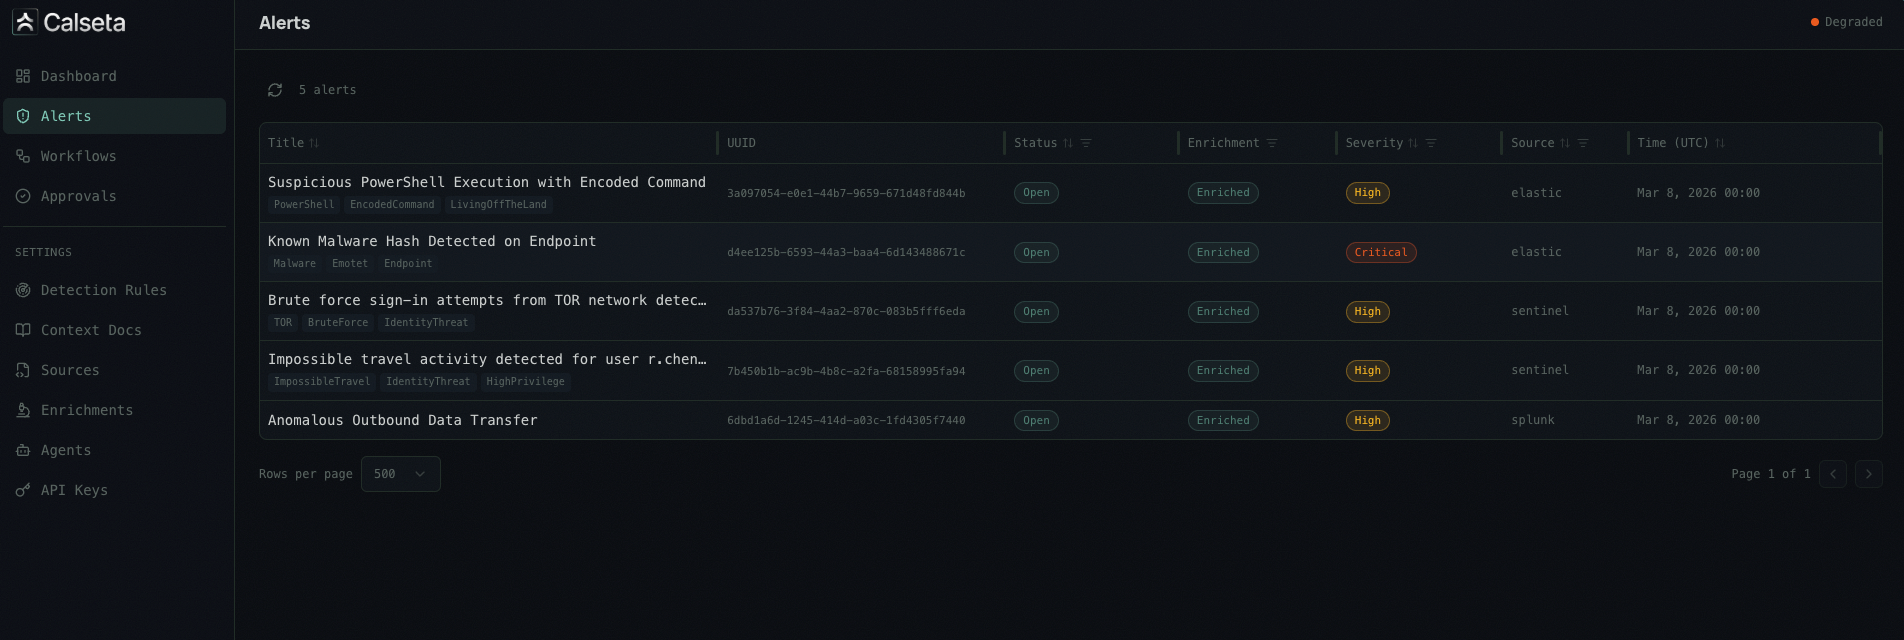 The alert list view shows all ingested alerts with their severity, status, enrichment status, and source. Click any alert to see the full detail view.
### Alert Detail
The alert list view shows all ingested alerts with their severity, status, enrichment status, and source. Click any alert to see the full detail view.
### Alert Detail
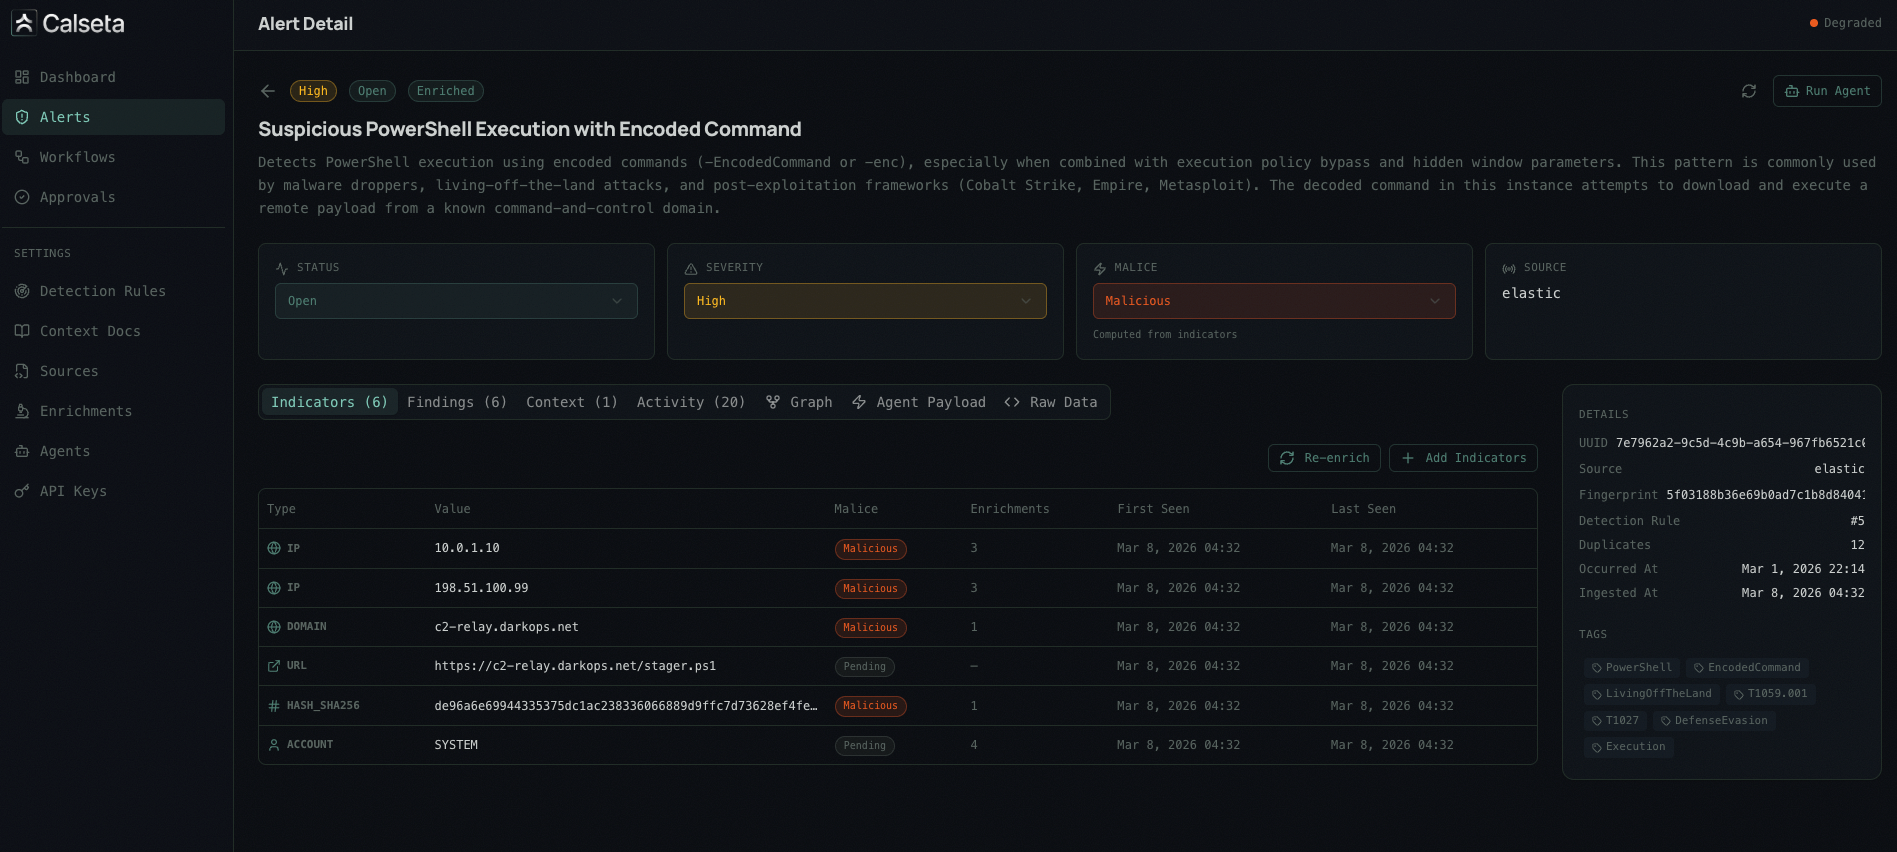 The alert detail view includes:
* **Alert metadata** — title, severity, status, source, timestamps
* **Indicators** — extracted IOCs with malice verdicts and enrichment results
* **Enrichment results** — per-provider breakdown (VirusTotal, AbuseIPDB, etc.)
* **Context documents** — matched runbooks and SOPs
* **Activity timeline** — audit log of all actions taken on the alert
* **Relationship graph** — visual map of indicator relationships across alerts
## Navigation
The sidebar is organized into three sections:
### Main
* **Dashboard** — overview metrics and recent activity
* **Alerts** — alert list and detail views
* **Workflows** — workflow code, execution history, and approval settings
* **Approvals** — pending and resolved approval requests
### Manage
* **Agents** — register and manage agent webhook endpoints with trigger filters
* **Enrichments** — configure builtin and custom enrichment providers, view status, test against sample indicators. The **Field Extractions** tab on each provider's detail page manages which fields from raw API responses are surfaced to agents.
* **Detection Rules** — view and edit detection rules with MITRE ATT\&CK mappings and documentation (auto-created when alerts arrive)
* **Context Docs** — upload and manage runbooks, IR plans, and SOPs with targeting rules
### Settings
* **API Keys** — create and manage API keys with scoped permissions
* **Alert Sources** — configure alert source integrations and webhook endpoints
* **Indicator Mappings** — manage indicator field extraction mappings (system-seeded normalized mappings and custom per-source mappings against raw payloads)
## Access
The UI runs as a separate dev server during local development:
```bash theme={null}
cd ui && npm install && npm run dev
```
When using `make dev` or `make lab`, the UI server starts automatically.
For production deployments, build the UI as static assets with `cd ui && npm run build` and serve them via your preferred web server or CDN.
The alert detail view includes:
* **Alert metadata** — title, severity, status, source, timestamps
* **Indicators** — extracted IOCs with malice verdicts and enrichment results
* **Enrichment results** — per-provider breakdown (VirusTotal, AbuseIPDB, etc.)
* **Context documents** — matched runbooks and SOPs
* **Activity timeline** — audit log of all actions taken on the alert
* **Relationship graph** — visual map of indicator relationships across alerts
## Navigation
The sidebar is organized into three sections:
### Main
* **Dashboard** — overview metrics and recent activity
* **Alerts** — alert list and detail views
* **Workflows** — workflow code, execution history, and approval settings
* **Approvals** — pending and resolved approval requests
### Manage
* **Agents** — register and manage agent webhook endpoints with trigger filters
* **Enrichments** — configure builtin and custom enrichment providers, view status, test against sample indicators. The **Field Extractions** tab on each provider's detail page manages which fields from raw API responses are surfaced to agents.
* **Detection Rules** — view and edit detection rules with MITRE ATT\&CK mappings and documentation (auto-created when alerts arrive)
* **Context Docs** — upload and manage runbooks, IR plans, and SOPs with targeting rules
### Settings
* **API Keys** — create and manage API keys with scoped permissions
* **Alert Sources** — configure alert source integrations and webhook endpoints
* **Indicator Mappings** — manage indicator field extraction mappings (system-seeded normalized mappings and custom per-source mappings against raw payloads)
## Access
The UI runs as a separate dev server during local development:
```bash theme={null}
cd ui && npm install && npm run dev
```
When using `make dev` or `make lab`, the UI server starts automatically.
For production deployments, build the UI as static assets with `cd ui && npm run build` and serve them via your preferred web server or CDN.